- The Crypto Fire
- Posts
- Mastering Crypto Analysis Tools (Part 1)
Mastering Crypto Analysis Tools (Part 1)
A practical guide (part 1) to using top crypto analysis tools for cryptocurrency. A deep dive into TokenTerminal, Glassnode, and Messari.io.

Table of Contents
📊 Why You Need a Crypto Analysis Tool in Crypto Investing
If you’ve been in cryptocurrency long enough, you know the charts never tell the full story. Prices move, altcoins pump, tokens crash, but behind every candle there is always its own story.
Instead of trading blind, you can track real fundamentals: revenue, user activity, token flow, and research reports. Whether you’re into Bitcoin, Ethereum, or the next altcoin gem, using the right crypto analysis tool helps you separate hype from reality. Think of it as your personal radar system in a market full of noise.
🔥 TokenTerminal
When you hear people talking about fundamentals in crypto, we are referencing insights that come from TokenTerminal. Unlike a simple charting platform, this crypto analysis tool digs into the business side of blockchains.
How do you use Token Terminal for free?
Home
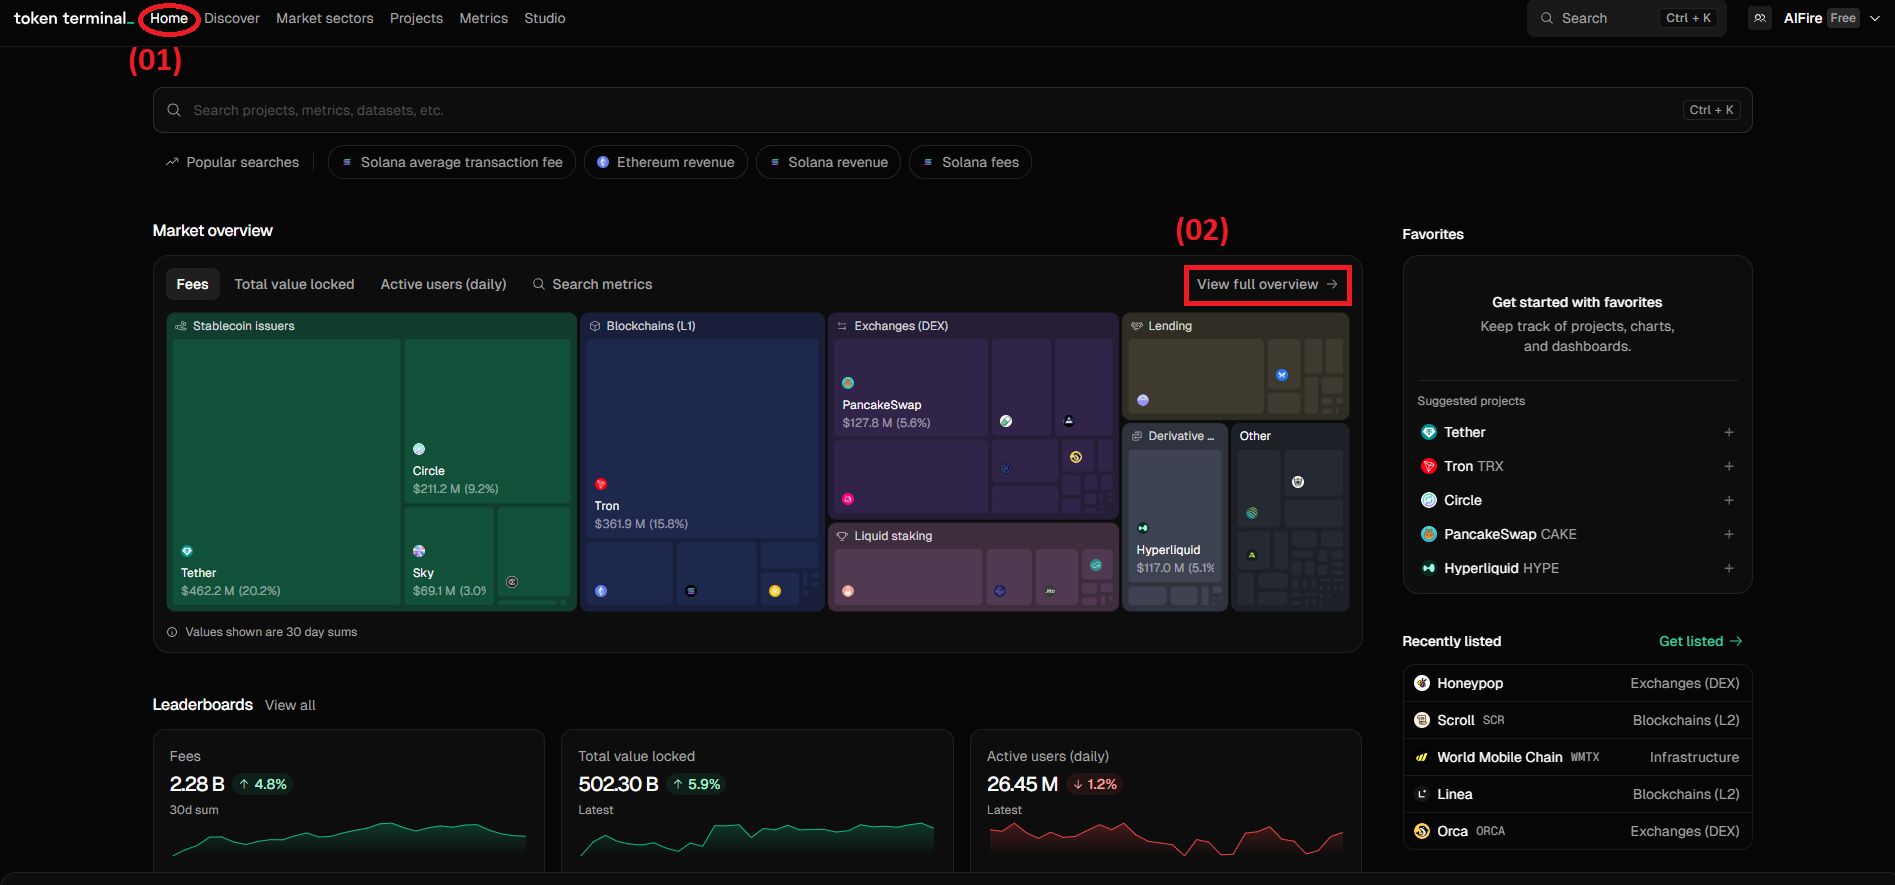
On the Home page, you can see the market overview (01) and visualize multiple metrics by choosing View full overview (02).
In this tab, you can search all metrics you want to get a general view of the market on the top, and sort them by sectors or category on the right side.
Back on the Home page, below the chart, you may see the leaderboards.
You will find weekly gainers and losers across several metrics:
Market Sectors
You can see a full view of crypto market sectors ranked by fees in the past 365 days. Users can see which sectors make the most money, their market share, and how fees have changed over time.
Below, there’s a table with sector details: number of projects, top 3 projects by fees, total fees earned, fee growth trend, and market share. Users can also search sectors, filter by time period, and quickly spot leaders or underperformers in each category.
Project
In addition to market analysis, you can do an in-depth scan of each of the 270 dApps and networks listed on the platform.
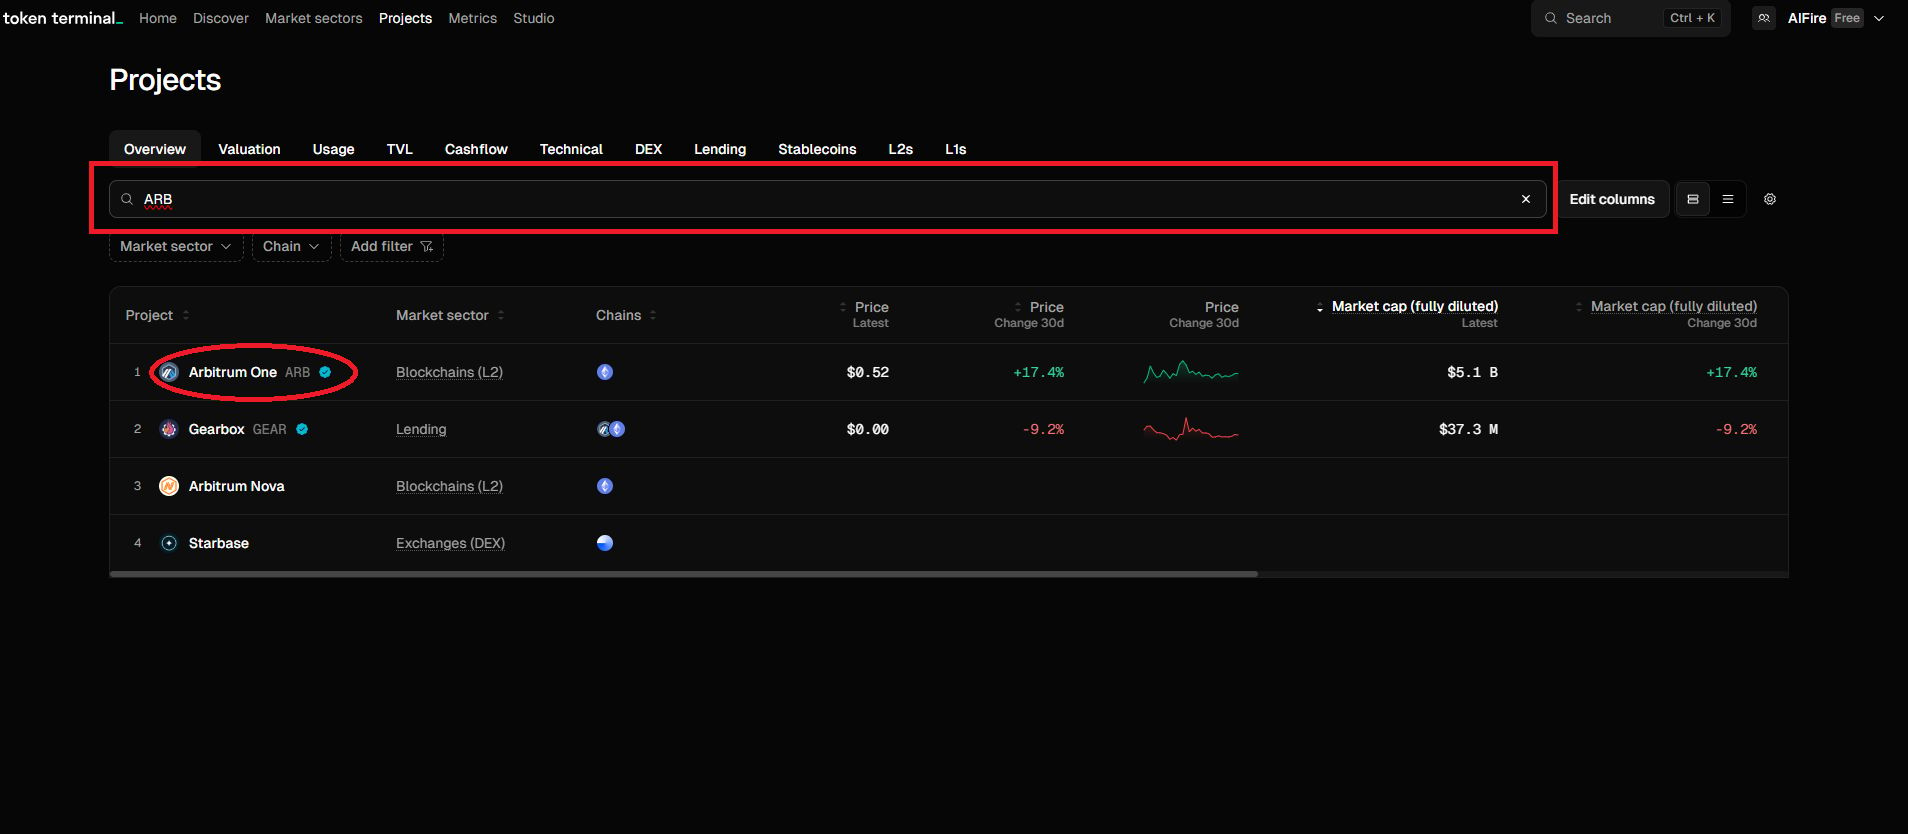
You can access them through the Projects page, but a more straightforward approach is to look for each project in the search box at the top of the page.
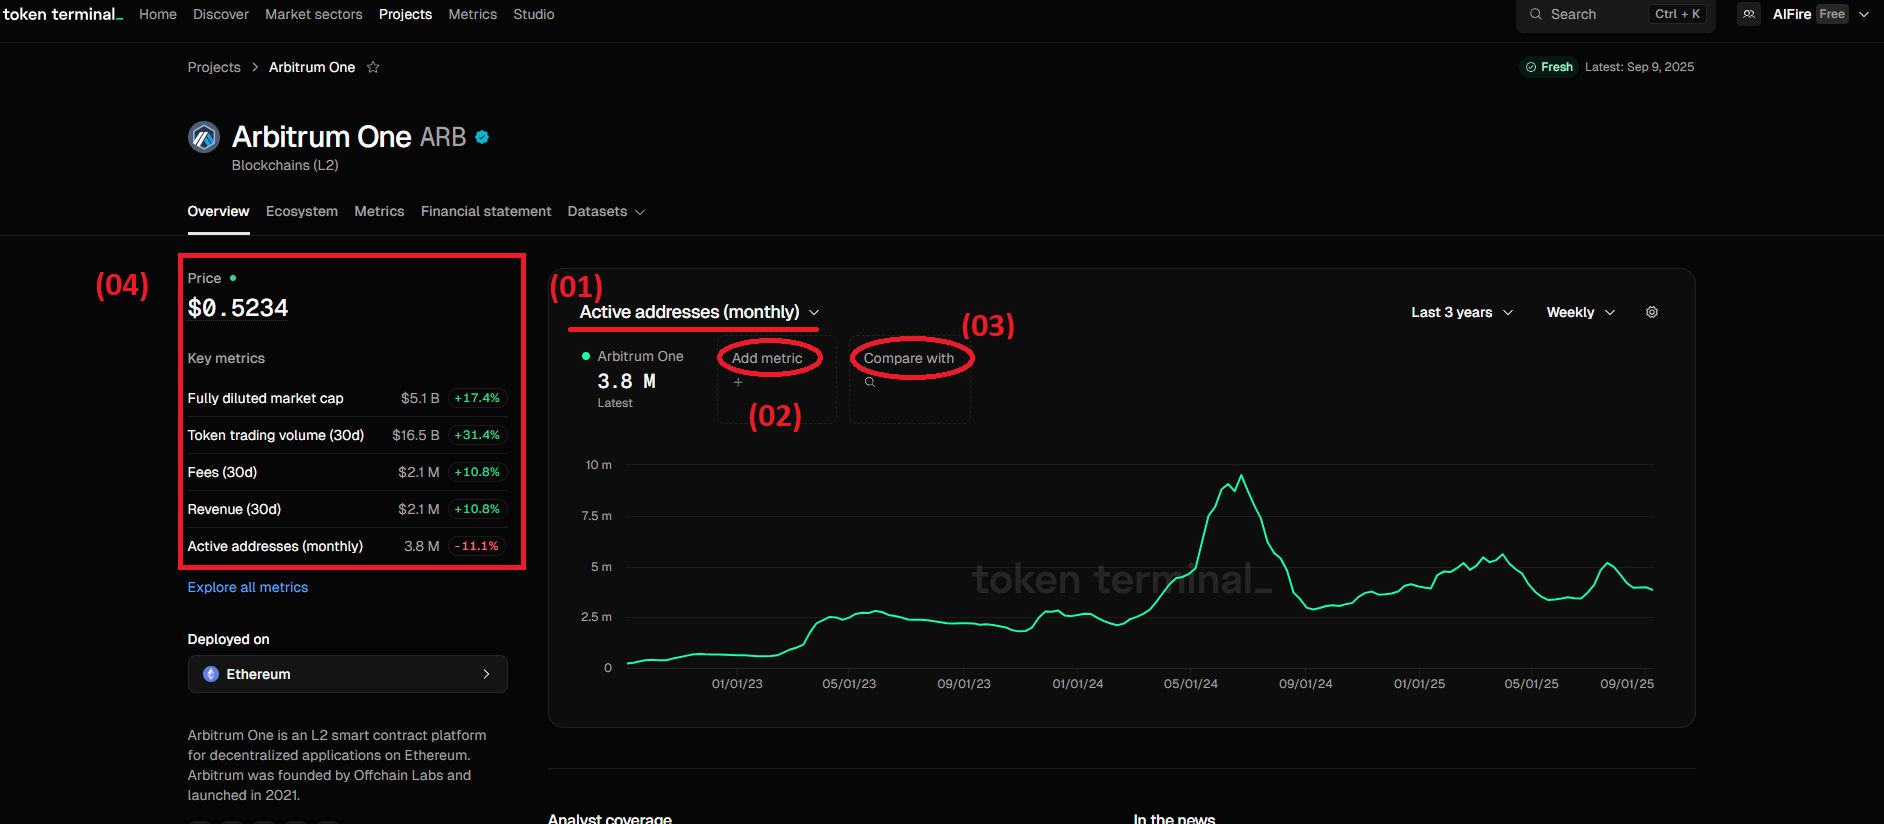
For each dapp or blockchain network, you will see two main sections: a chart that can be customized to visualise multiple metrics (01), compare with other metrics (02) and projects (03), and an overview dashboard (04).
Let’s use Arbitrum One $ARB.X ( ▲ 2.92% ) as an example, one of the most popular. Here is what the overview section looks like – it shows key metrics with 3 years changes and some general info on the left side.
One of the features I like about Token Terminal is the ‘financial statements’ tool. It shows the weekly, monthly, or quarterly dynamics of fees, revenue, token prices, and more.
Metric
On the Metrics page, you can visualize every single metric for the crypto market and its main sectors.
When you pick a metric, such as Fully diluted market cap, you get a quick overview, a main chart with historical data, and a comparison view across blockchains and projects. You can adjust the date range and include any supported apps, assets, or networks to track their performance side by side.
When you sign up for Token Terminal, you get a free 7-day Pro trial. The best part is it starts right away and doesn’t ask for any payment details.
💰 Glassnode
Glassnode is quite different, it is your on-chain microscope. This crypto analysis tool looks at raw blockchain data and translates into usable charts and unique metrics. If you want to know what whales, miners, retail traders and crypto cycles are doing in real time, Glassnode is the place.
Start with the basics
Home
At the top of the page (01), you can switch between Home, Charts, Dashboards, Insights, and Resources to opt for different features, and of course I will explain below.
You can choose ranking lists based on different types such as Fundamentals, PnL, Supply Dynamics or Future with any specific assests you want to.
it's quite effective because we don't always need to see all those assets, simply when I want to follow AI tokens it can rank right away and I like this.
Charts
On this page, the long list of metrics on the left can feel overwhelming since each parameter comes with multiple detailed charts.
The experience becomes much easier if you decide beforehand which metrics matter most to you, then focus on those and pick the matching charts. You can also use the chart filter to quickly sort and find exactly what you need.
One thing I really enjoy about Glassnode’s charts is the smooth, adjustable time bar — it lets you change the view instantly without the hassle of manually zooming in and out.
Dashboards
On the left panel, you can select a topic or dashboard (01), such as Mining or Cost of Production, Entity,.... This menu lets you switch between different research areas and load their data views.
In the Center, you’ll see a short explanation (02) of the selected topic or metric. This helps you understand what the data means and how to read the charts.
On the right side and at the bottom, you get interactive charts (03) that show the historical data. You can zoom, change timeframes, and compare metrics to analyze patterns and trends.
This is one of Glassnode’s standout features — it’s built for a wide range of users, not just traders. The dashboards are highly customizable, letting you track multiple metrics at once so you can get a clearer picture and make better, data-driven decisions.
Insights
The Insights section is the area where users can read research articles, weekly market reports, and in-depth analyses. It includes content like BTC Market Pulse, The Week On-Chain, and Altcoin Vector, which give professional commentary on Bitcoin, Ethereum, and the broader crypto market.
Some articles are free to read, while others are locked and require a paid plan to access.
Once again, what makes Glassnode great is its wide range of on-chain metrics, from activity and supply to profit/loss and sentiment, all cleaned and entity-adjusted for accuracy. It offers smooth charting tools, customizable dashboards, and an easy API for deeper analysis.
This crypto analysis tool gives research, alerts, and market insights that help traders, investors and even miners make better decisions.
🧠 Messari.io
Messari.io is the research-driven crypto analysis tool of the crypto world. If TokenTerminal is about fundamentals and Glassnode about on-chain behavior, Messari is where you get the macro perspective: narratives, sector analysis, and token-specific reports.
Let’s set this up
Home
Messari’s interface can feel a bit tricky for beginners, I felt the same way. The homepage shows crypto rankings, but unlike other tools, they aren’t organized by asset class.
In the center, you can compare tokens, though the loading speed can be frustratingly slow. There’s also a news feed on the side for quick updates.
The best part is that Messari lets you customize which categories appear on your homepage, so you can tailor it to what matters most to you.
Research
Messari crypto analysis tool also brings together a huge library of project research and analysis in this feature, making it a great place to explore deeper insights. The interface here feels a bit more user-friendly, a little bit…
The research content is divided into several types such as Research Reports, Protocol Reports, Diligence Reports, Newsletters, and Podcasts. In these sections, you can sort and filter by the tags you want (01), and the list will automatically update (02) to show matching research pieces.
Each item includes the date, author, and relevant tags so you can quickly find exactly what you’re looking for.
If you’re looking for token overviews and fundamental analysis, Messari’s authors provide thorough and detailed reports. It’s a quick and reliable way to stay updated with complete information on any token.
Datasets
This section is the Datasets → Assets page on Messari. On the left side, you can filter assets by Category, Exchange, or by ecosystem. You can also filter by exchanges or networks to narrow the list further.
In the main table, you’ll see a detailed ranking of assets with live data - price, market cap, 24H/7D/30D changes, volume, and even sub-sector classification (like Layer-1, Oracles, Stablecoins, etc.). This lets you compare assets side by side and track market performance across different sectors quickly.
Messari Copilot
Messari is one of the few crypto analysis tools with built-in AI, allowing users to research and optimize their searches more efficiently. You can type questions about crypto, projects, or market trends and get data-backed answers. It also saves your conversation history, making it easy to revisit or refine past questions.
Signals
Signals highlights trending assets, sectors, and narratives across the market. You can filter by themes like DeFi, AI, or Memecoins, then see mindshare growth, weekly performance, and sentiment shifts.
They also give current sentiment on the market situation in this context.
On the right, it shows trending topics, X posts, and key opinion leaders (KOLs) so you can catch narratives early and stay ahead of the market.
Fundraising
(01) Key Metrics – This area gives a quick snapshot of the fundraising market. You can see the total capital raised, number of rounds, average deal size, active investors, and the most active sector. The data can be filtered by time range (1M, 3M, 6M, 1Y) so you can spot trends over different periods.
(02) Top Rounds – A list of the largest funding rounds in the last 30 days, showing the company information, and amount raised. This helps you track which projects recently attracted the most capital.
(03) Funding Trends – A bar chart showing the total amount raised over time. You can zoom out to view up to 5 years of data and quickly see market cycles, peak funding periods, and slowdowns.
(04) Top Investors – A ranking of the most active investors over the last 3 months, displayed with the number of deals they participated in.
In addition, this function lets you connect with investors and funds, such as Bitcoin Treasury Funds and Unified Venture Funds, directly through the Fundraising feature to raise capital for your project. Even though it’s a relatively new feature, it has already turned Messari into a powerful bridge between investors and projects.
🍁 CryptoQuant
CryptoQuant is a powerful crypto analysis tool that focuses on on-chain and market data, giving traders a clear view of exchange flows, miner activity, and whale behavior. Its main function is to help users spot potential market moves early by tracking key metrics like reserves, inflows, and funding rates.
Let’s walk through it.
Community
This section is where authors and analysts share new chart models they’ve built using CryptoQuant’s data. You can explore these models to find fresh perspectives on the market.
It’s also a place where you’ll see in-depth analysis based on those charts. This helps you learn how other experts interpret the data and apply it to their trading strategies.
Charts
This is the Charts page of CryptoQuant, where you can explore a huge collection of on-chain and market indicators in one place. On the left sidebar, you’ll find a full list of metrics from Exchange Flows and Miner Flows to Fund Data, and more.
In the center, Featured Indicators for both spot and futures markets shows its current status and you’ll find Trending Metrics that highlight the most-watched charts right now, helping you stay focused on what matters most in the market.
Insight
This is the Insights page of CryptoQuant, where you can read detailed on-chain and market analysis from top authors. The main section shows featured posts with charts and data-backed explanations, like this one about stablecoin reserves reaching a new all-time high.
On the right side, you can find Trending Posts to quickly see what the community is talking about and which topics are heating up. You also get a list of Top Authors, so you can follow their work and never miss their insights.
⚖️ My Crypto Analysis tools View
Each crypto analysis tool has its own strength. TokenTerminal gives you fundamentals, Glassnode shows you real-time on-chain behavior, and Messari adds big-picture research with their fundraising connection.
But the real edge comes when you combine them. That way, you don’t just buy because of hype, or hold based on faith. You invest with a layered strategy: fundamentals + on-chain signals + research narrative + Funds.
In a market as fast-moving as crypto, that’s how you stay one step ahead.
Rate us today!Your feedback helps us improve and deliver better Crypto content! |


Reply